
LatestEconomy
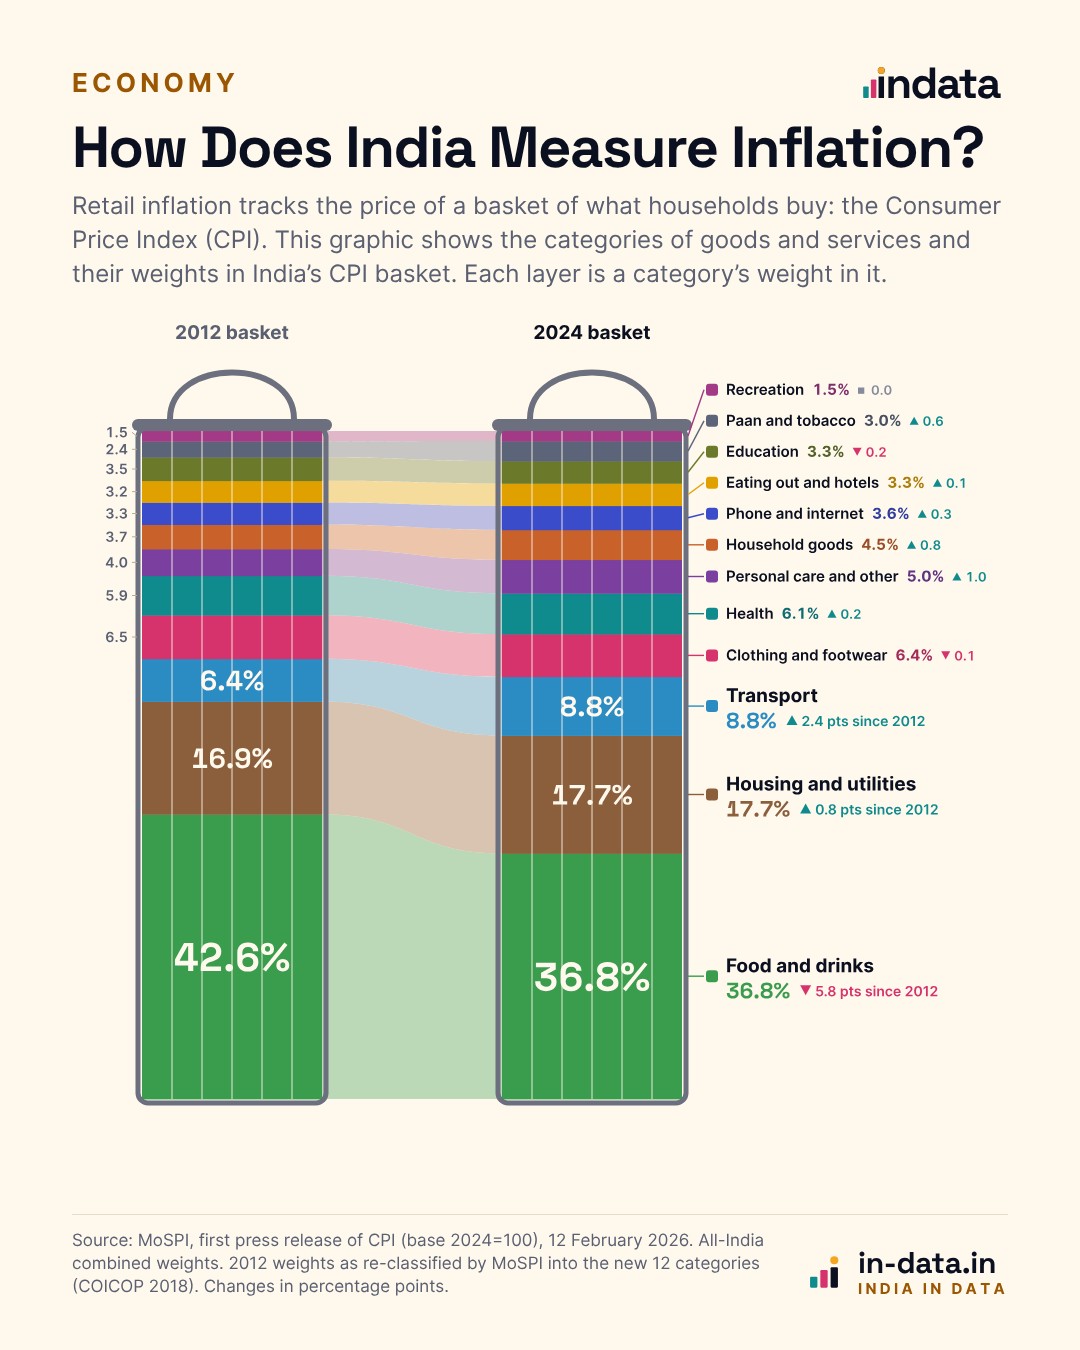
How Does India Measure Inflation? Inside the CPI Basket
See how the basket of goods and services in the Consumer Price Index (CPI)—used to measure retail inflation—has changed from 2012 to 2024.
Read the storySource: Ministry of Statistics and Programme Implementation (MoSPI), CPI (base 2024 = 100)
Coming up
A new chart every day, Monday to Saturday.
 Thu 12 Nov
States
Maruti Is India’s Best-Selling Car Brand in Every State but One
 Fri 13 Nov
Motion
Breaking Down the Cost of 1 Litre of Petrol
 Sat 14 Nov
Food & culture
India’s Coffee Production, by Region
 Mon 16 Nov
Money